Camera Accuracy Specs and the Uncertainty Equation
You’ll notice that most IR camera data sheets show an accuracy specification such as ±2ºC or 2% of the reading. This specification is the result of a widely used uncertainty analysis technique called “Root‐Sum‐of‐Squares”, or RSS. The idea is to calculate the partial errors for each variable of the temperature measurement equation, square each error term, add them all together, and take the square root. While this equation sounds complex, it’s fairly straightforward. Determining the partial errors, on the other hand, can be tricky.
“Partial errors” can result from one of several variables in the typical IR camera temperature measurement equation, including:
- Emissivity
- Reflected ambient temperature
- Transmittance
- Atmosphere temperature
- Camera response
- Calibrator (blackbody) temperature accuracy
Once reasonable values are determined for the “partial errors” for each of the above terms, the overall error equation will look like this:
Total Error = √ ∆T1² + ∆T2² + ∆T3²
Where the ΔT1, ΔT2, ΔT3, etc are the partial errors of the variables in the measurement equation.
Why do this? It turns out that random errors sometimes add in the same direction, taking you farther from the true value, while other times they add in opposite direction and cancel each other out. Taking the RSS gives you a value that is most appropriate for an overall error specification. This has historically been the specification shown on FLIR camera data sheets.
It’s worth mentioning that the calculations discussed so far are only valid if the camera is bein used in the lab or at short range (less than 20 meters) outside. Longer ranges will introduce uncertainty in the measurement because of the atmospheric absorption and to a lesser extent, its emission. When a camera R&D engineer performs an RSS analysis for almost any modern IR camera system under lab conditions, the resulting number is around ±2ºC or 2% – making this a reasonable accuracy rating to use in camera specifications.
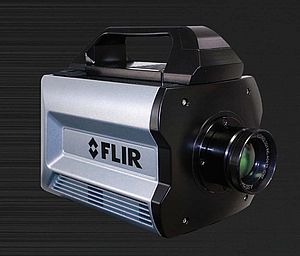
However, practice shows us that high performance cameras, such as the FLIR X6900sc, give much better results than economical cameras like the FLIR E40, so we still have some work to do to better explain this observation.
Laboratory Measurements and ±1°C or 1% Accuracy
In this section, we take a look at the temperature measurements a camera actually produces when looking at an object of known emissivity and temperature. Such an object is commonly referred to as a “blackbody”. You may have heard this term before in reference to the theoretical concept of an object with known emissivity an temperature. It is also used to describe a piece of lab equipment which closely emulates this concept. FLIR’s calibration lab with quarter circle of at least 2 cavity blackbodies is shown below.
Laboratory measurements of uncertainty involve pointing a calibrated camera at a calibrated blackbody and plotting the temperature over a period of time. Despite the careful calibrations, there will always be some random error in the measurement. The resulting data set can be quantified for accuracy and precision. Figure 2, below, demonstrates the results from calibrated blackbody measurement.
The below plot shows more than two hours of data from a FLIR A325sc camera looking at a 37ºC blackbody at a range of 0.3 meter in an indoor environment. The camera recorded the temperature once per second. The data plotted is the average of all pixels in the image. A histogram of this data would make it clearer, but most of the data points were between 36.8ºC and 37ºC. The widest ranging temperatures recorded were 36.6ºC and 37.2ºC.
Looking at this data, it would be tempting to claim an expected accuracy of 0.5ºC for the average of all the pixels. One could even claim ±1ºC for the FLIR A325sc and any other camera using the same detector. However, one could also argue that the above graph shows an average of all of the pixels and may not be representative of an individual pixel.
One way of knowing how well all of the pixels agree with each other is to look at standard deviation versus time. This is represented in Figure 3. The graph shows that the typical standard deviation is less than 0.1ºC. The occasional spikes to around 0.2ºC are a result of the camera’s 1‐point update, a type of self‐calibration procedure that all microbolometer‐based cameras must perform periodically.
So far we have discussed collecting data from uncooled microbolometer cameras. How will the results differ for a high-performance quantum detector camera?
Figure 4 shows the response of a typical 3‐5 μm camera with an Indium Antimonide (InSb) detector, such as the FLIR X6900sc. That camera’s documentation shows the accuracy tested at ±2ºC or 2%. On the graph below, you can see the results fall well within those specifications: the accuracy reading on that day was around 0.3ºC and the precision reading was around 0.1ºC. But why is the offset error at 0.3ºC? This could be cause by the calibration of the blackbody, the calibration of the camera, or any of the partial error terms mentioned in section 2. Another possibility is the camera was simply warming up at the beginning of the measurement. If the optics or the inside of the camera body are changing temperature, they may offset the temperature measurement.
The conclusion we can draw from these two calibration tests is that both microbolometer and photon‐counting quantum detector cameras can be factory calibrated to provide accuracies of less than 1ºC when looking at 37ºC objects of known emissivity under typical indoor environmental conditions.
Ambient Temperature Compensation
One of the most critical steps in factory calibrations is ambient temperature compensation. Infrared cameras – whether thermal or quantum detecting – respond to the total infrared energy falling on the detector. If the camera is designed well, most of this energy will be from the scene: very little results from the camera itself. However, it’s impossible to completely Figure 2 – Typical FLIR A325sc camera response when looking at a 37ºC blackbody Figure 3 – Standard Deviation of typical A325sc when looking at 37ºC blackbody Figure 4– Response of a typical InSb camera looking at a 35ºC blackbody eliminate the contribution from the materials surrounding the detector and the optical path. Without proper compensation, any changes to the temperature of the camera body or lenses will significantly alter the temperature readings the camera provides.
The best method for achieving ambient temperature compensation is to measure the temperature of the camera and optical path in up to three different locations. The measurement data is then included in the calibration equation. This can ensure accurate readings through the entire range of operating temperatures (typically ‐15ºC to 50ºC). This is particularly important for cameras that will be used outdoors or otherwise subjected to temperature swings.
Even with Ambient Temperature Compensation, it’s important to allow the camera to fully warm up before making critical measurements. Also, keep the camera and optics out of direct sunlight or other sources of heat. Changing the temperature of the camera and optics will have an adverse effect on measurement uncertainty.
We should note that not all camera makers include ambient temperature compensation in their calibration process. By not properly compensating for ambient temperature drift, the data from these cameras could show significant inaccuracies – as much as 10oC or more. Therefore, be sure to ask about calibrations and how they’re performed before investing in an IR camera.
Conclusion
As we have seen, the RSS uncertainty analysis technique allows us to determine the accuracy of infrared cameras, and that these cameras may have, at most, a 2ºC margin of error. With proper calibration and attention to factors such as ambient temperature, emissivity, and spot size, the possible margin of error can be less than 1ºC.
One final note: the information presented in this paper was primarily written with factory calibrated infrared cameras in mind. While the physics are applicable to user calibrations, the tools and methods needed for user calibrations vary depending on the system being discussed. In addition, being able to perform a good user calibration would allow you to perform a custom uncertainty analysis – making generalized specifications discussed in this paper less relevant.
Kristof Maddelein, FLIR Systems*


